Agentic Factory
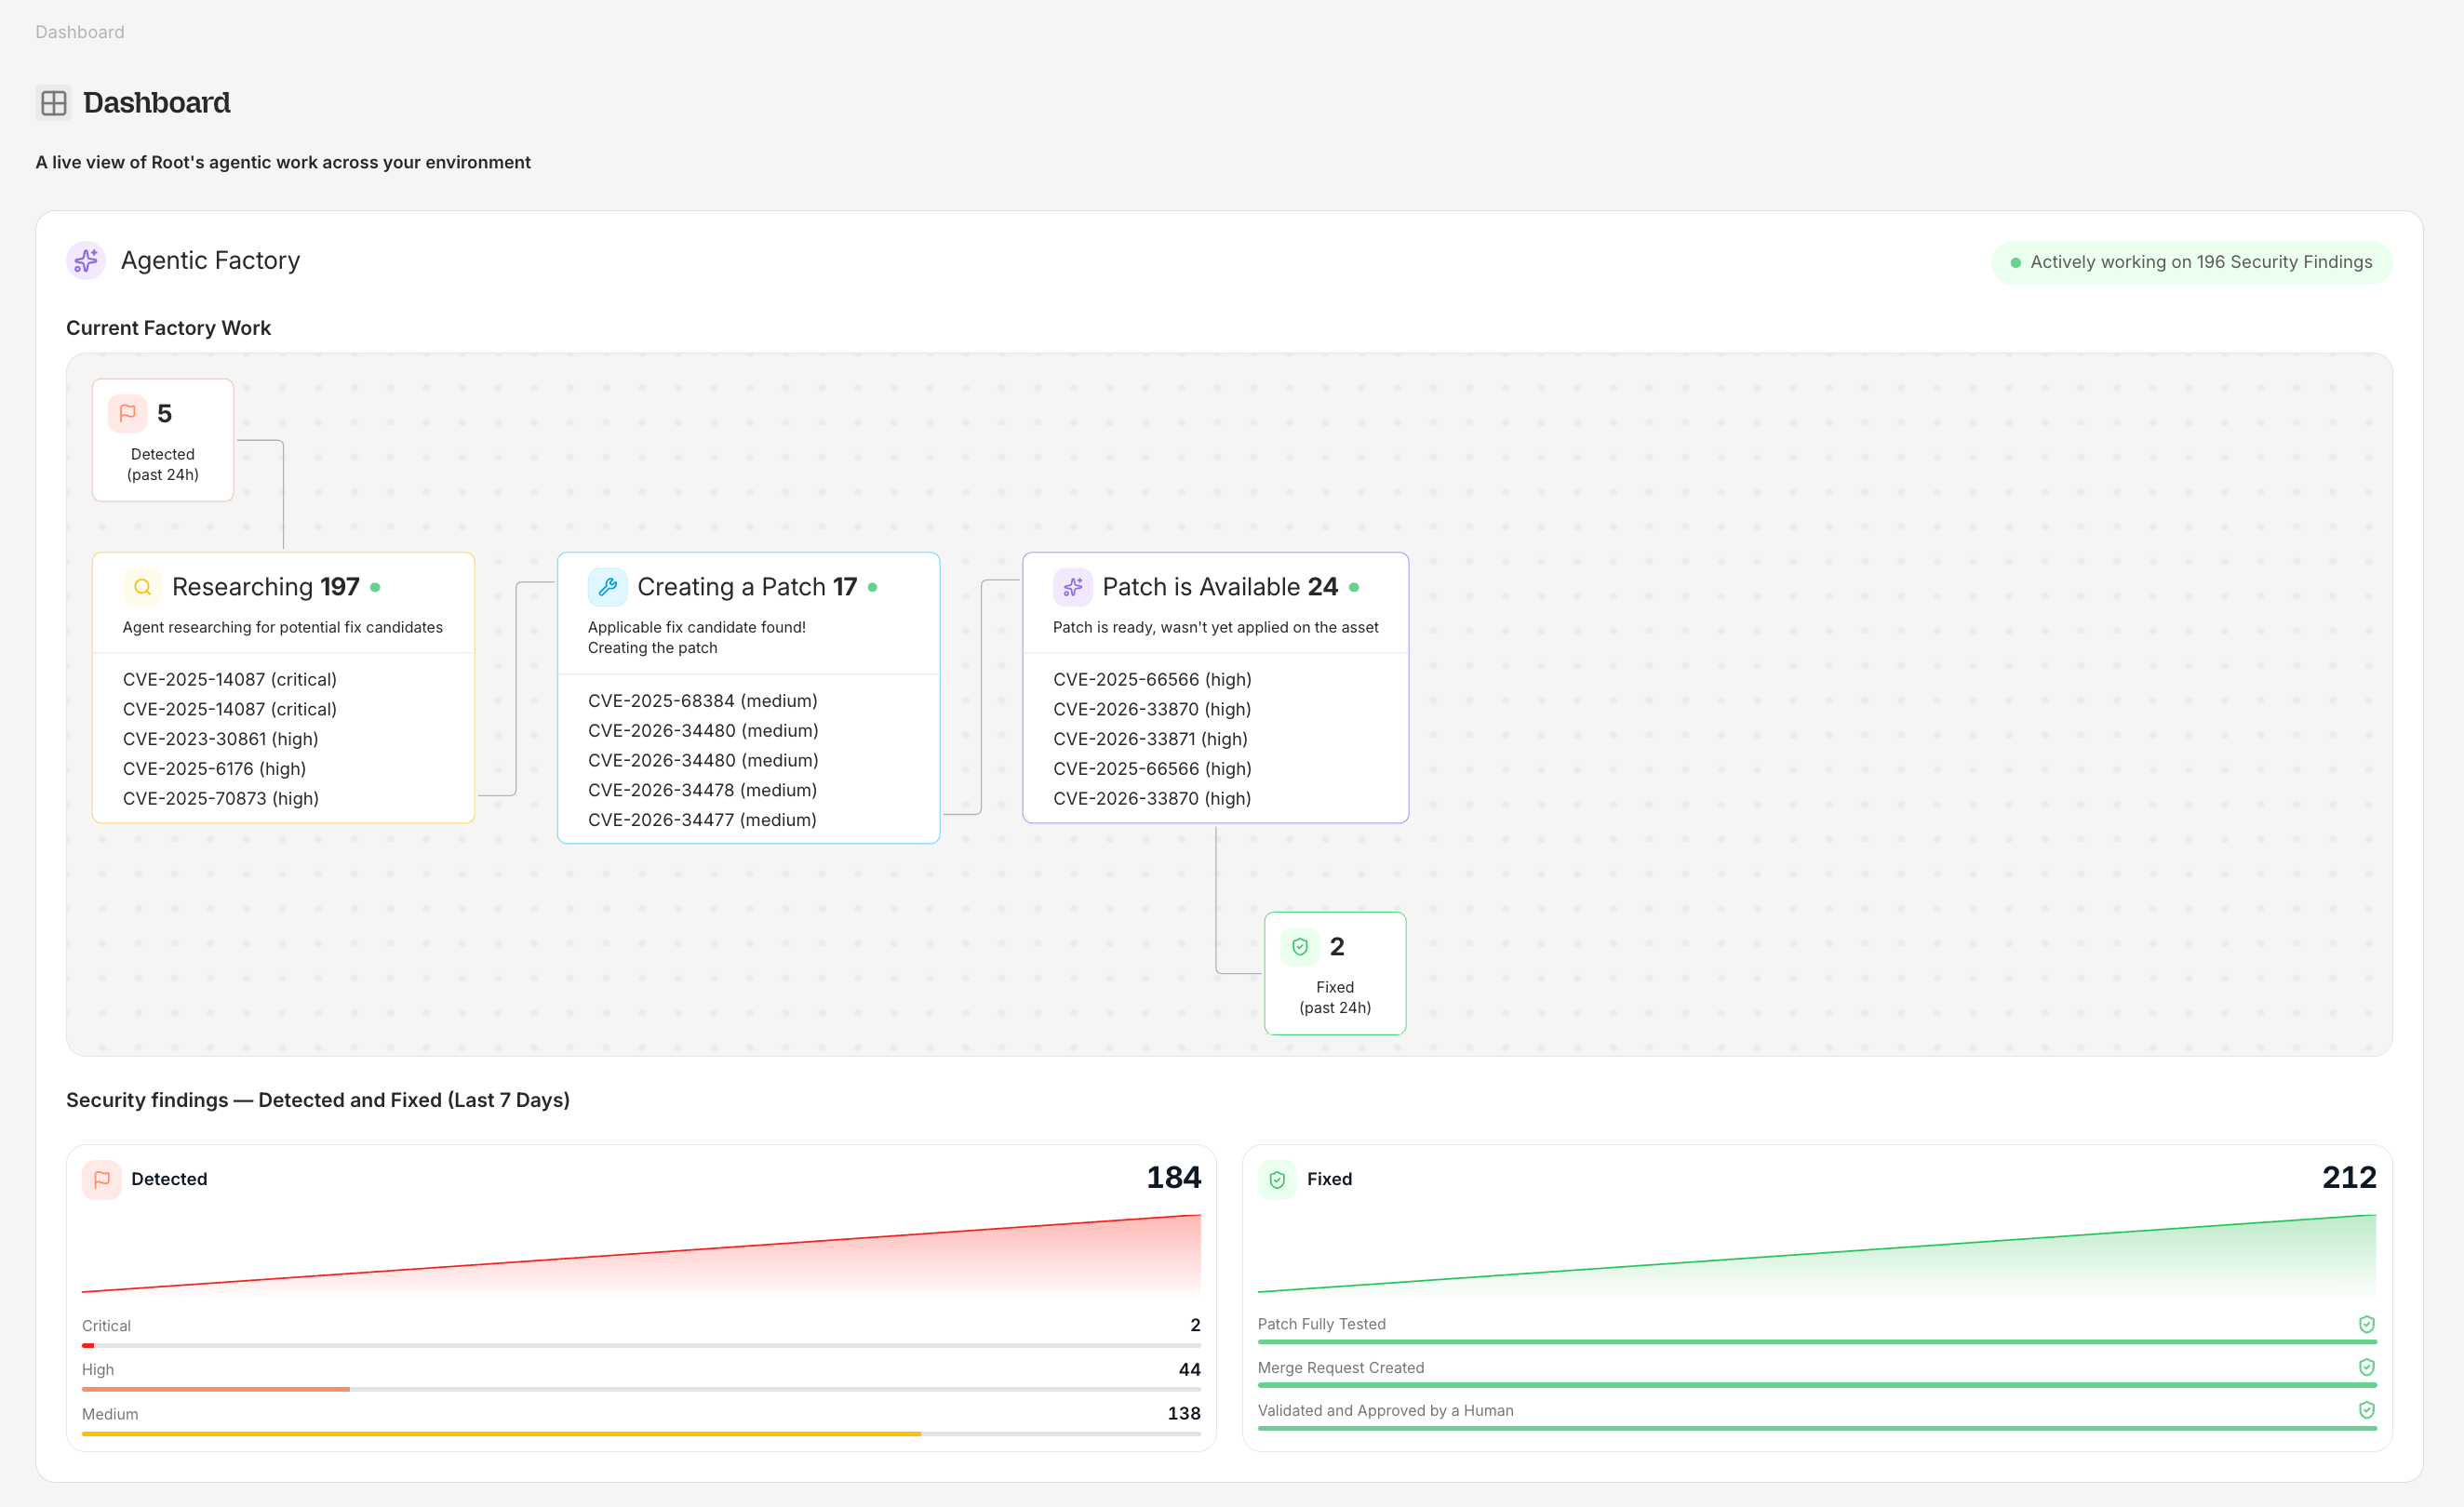
The Agentic Factory shows Root's pipeline working on your security findings in real time.
Current Factory Work
The Current Factory Work panel displays findings flowing through each stage of the pipeline:
Each stage card shows the count and lists individual CVEs with their severity. The Detected and Fixed stages are scoped to the past 24 hours; the three middle stages show all findings currently in that status.
Security findings — Detected and Fixed (Last 7 Days)
Below the factory, two summary cards show 7-day trends:- Detected — count of new findings with a severity breakdown (Critical, High, Medium) and a sparkline trend chart
- Fixed — count of resolved findings with a sparkline trend chart, plus verification steps completed: “Patch Fully Tested”, “Merge Request Created”, “Validated and Approved by a Human”
Protection Overview
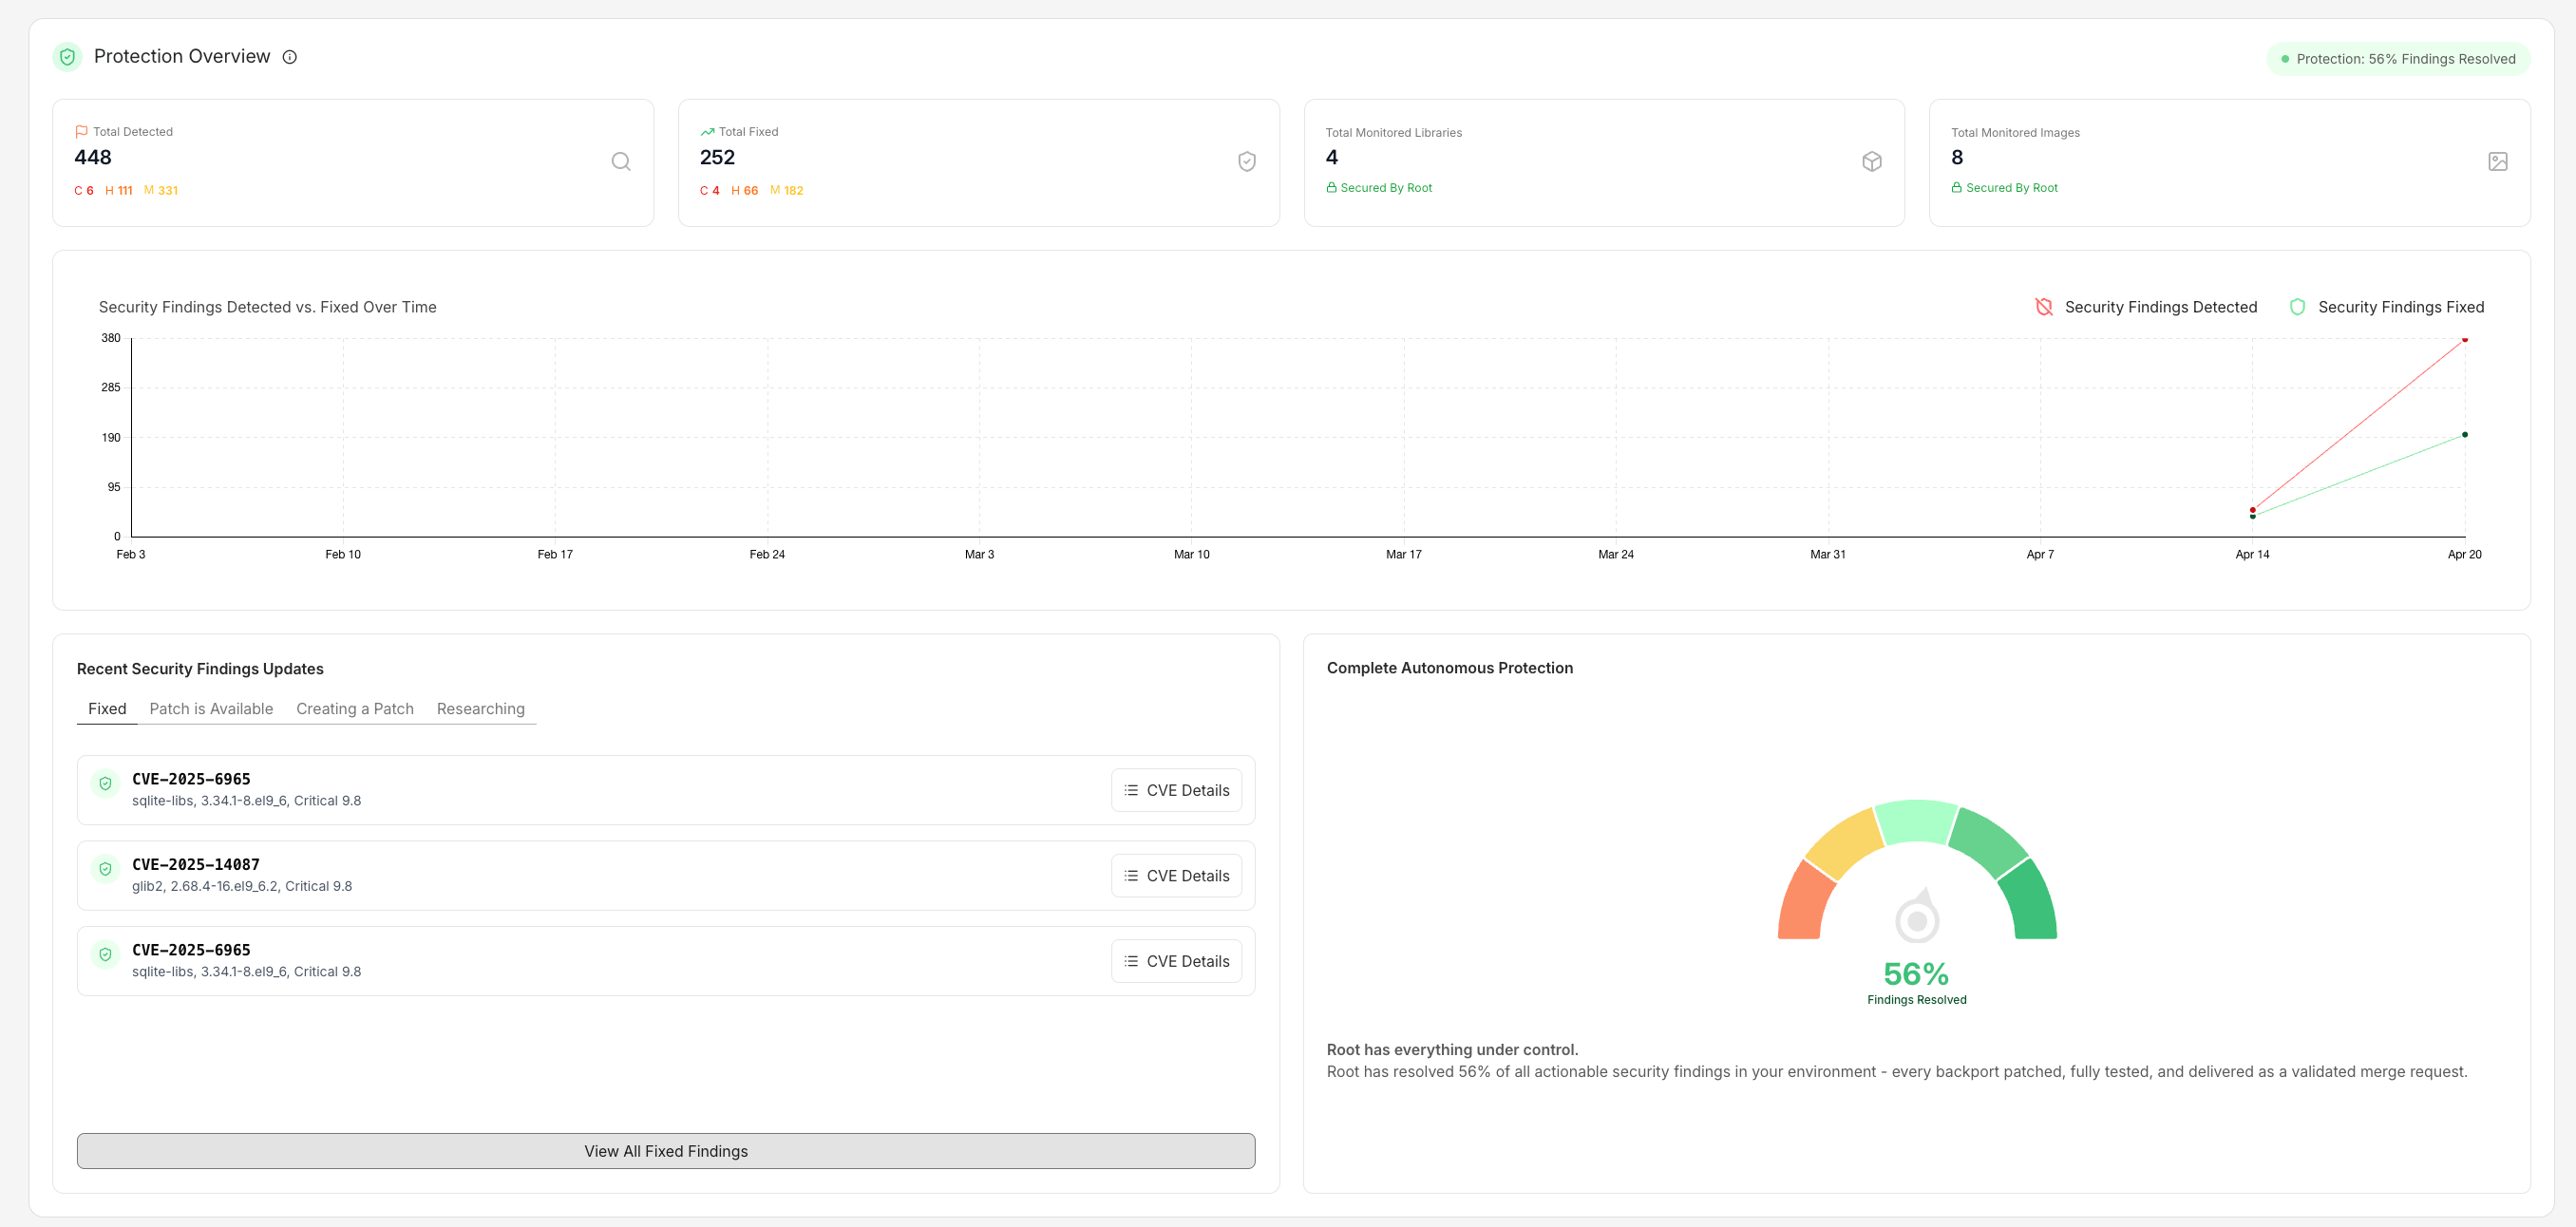
Protection Overview shows cumulative detection and remediation metrics across your fleet.
Summary panels
Security Findings Detected vs. Fixed Over Time
A line chart plots the cumulative count of detected findings and fixed findings over time, showing how remediation keeps pace with discovery.Recent Security Findings Updates
A tabbed feed showing the most recent findings across four status tabs:
Each entry includes the CVE ID, affected package and version, severity score, and a CVE Details button that links to the CVE Details page.
Complete Autonomous Protection
A gauge showing the percentage of actionable security findings that Root has resolved. When protection is high (e.g., 96%), the panel displays: “Root has everything under control. Root has resolved 96% of all actionable security findings in your environment — every backport patched, fully tested, and delivered as a validated merge request.”Security Findings page
The Security Findings page (accessible from the sidebar) lists every vulnerability across your subscribed images and discovered packages.This page may still appear as “Vulnerabilities” in parts of the sidebar while the rename rolls out.
Status tabs
Group by CVE
A single CVE can affect multiple assets — the same package across several images, plus libraries your organization uses. Use the Group by CVE option to see the total impact and scope of each vulnerability across your environment, rather than viewing each affected asset as a separate row.Medium vulnerabilities toggle
A global Medium vulns toggle controls whether Medium-severity findings appear in dashboard charts, the inventory vulnerability reduction column, and reports. Medium vulnerabilities are shown by default.Filtering
Filter the security findings table by:- Search — package name or CVE ID
- Ecosystem — PyPI, APK, APT, npm, Maven, Go
- Severity — Critical, High, Medium, Low, Unknown
- Status tab — Fixed / Working on a Patch / No Fix Available
SLA targets
Root defines two SLA tiers. Standard is included with all paid subscriptions; Enhanced is available at additional charge per Order Form. Standard SLA:
Enhanced SLA:
SLA timelines begin when both a CVE is published in a recognized vulnerability database and a Fix Candidate is available in the ecosystem. For full details including exclusions, surge conditions, and escalation to Root Labs, see Root’s Service Level Agreement.
Exporting metrics
CSV export: From the Security Findings page, use the export button to download the current filtered view as CSV. The export includes CVE ID, severity, CVSS score, package, ecosystem, OS, SLA status, and fix date. API access: All dashboard data is available via the Root API for integration with BI tools, dashboards, and SIEM:Sidebar navigation
The app sidebar provides access to:- Dashboard — this page
- Security Findings — the full CVE table with filtering
- Libraries — Library Catalog and My Library
- Images — Image Catalog and My Images
- Patcher Flow — the Agentic Patching visualization
- Settings — organization and account settings
- Invite Teammates — add team members to your organization
- Documentation — links to docs.root.io
- Get Help — contact Root support